- Joined
- Jan 4, 2015
- Messages
- 100
- Reaction score
- 53
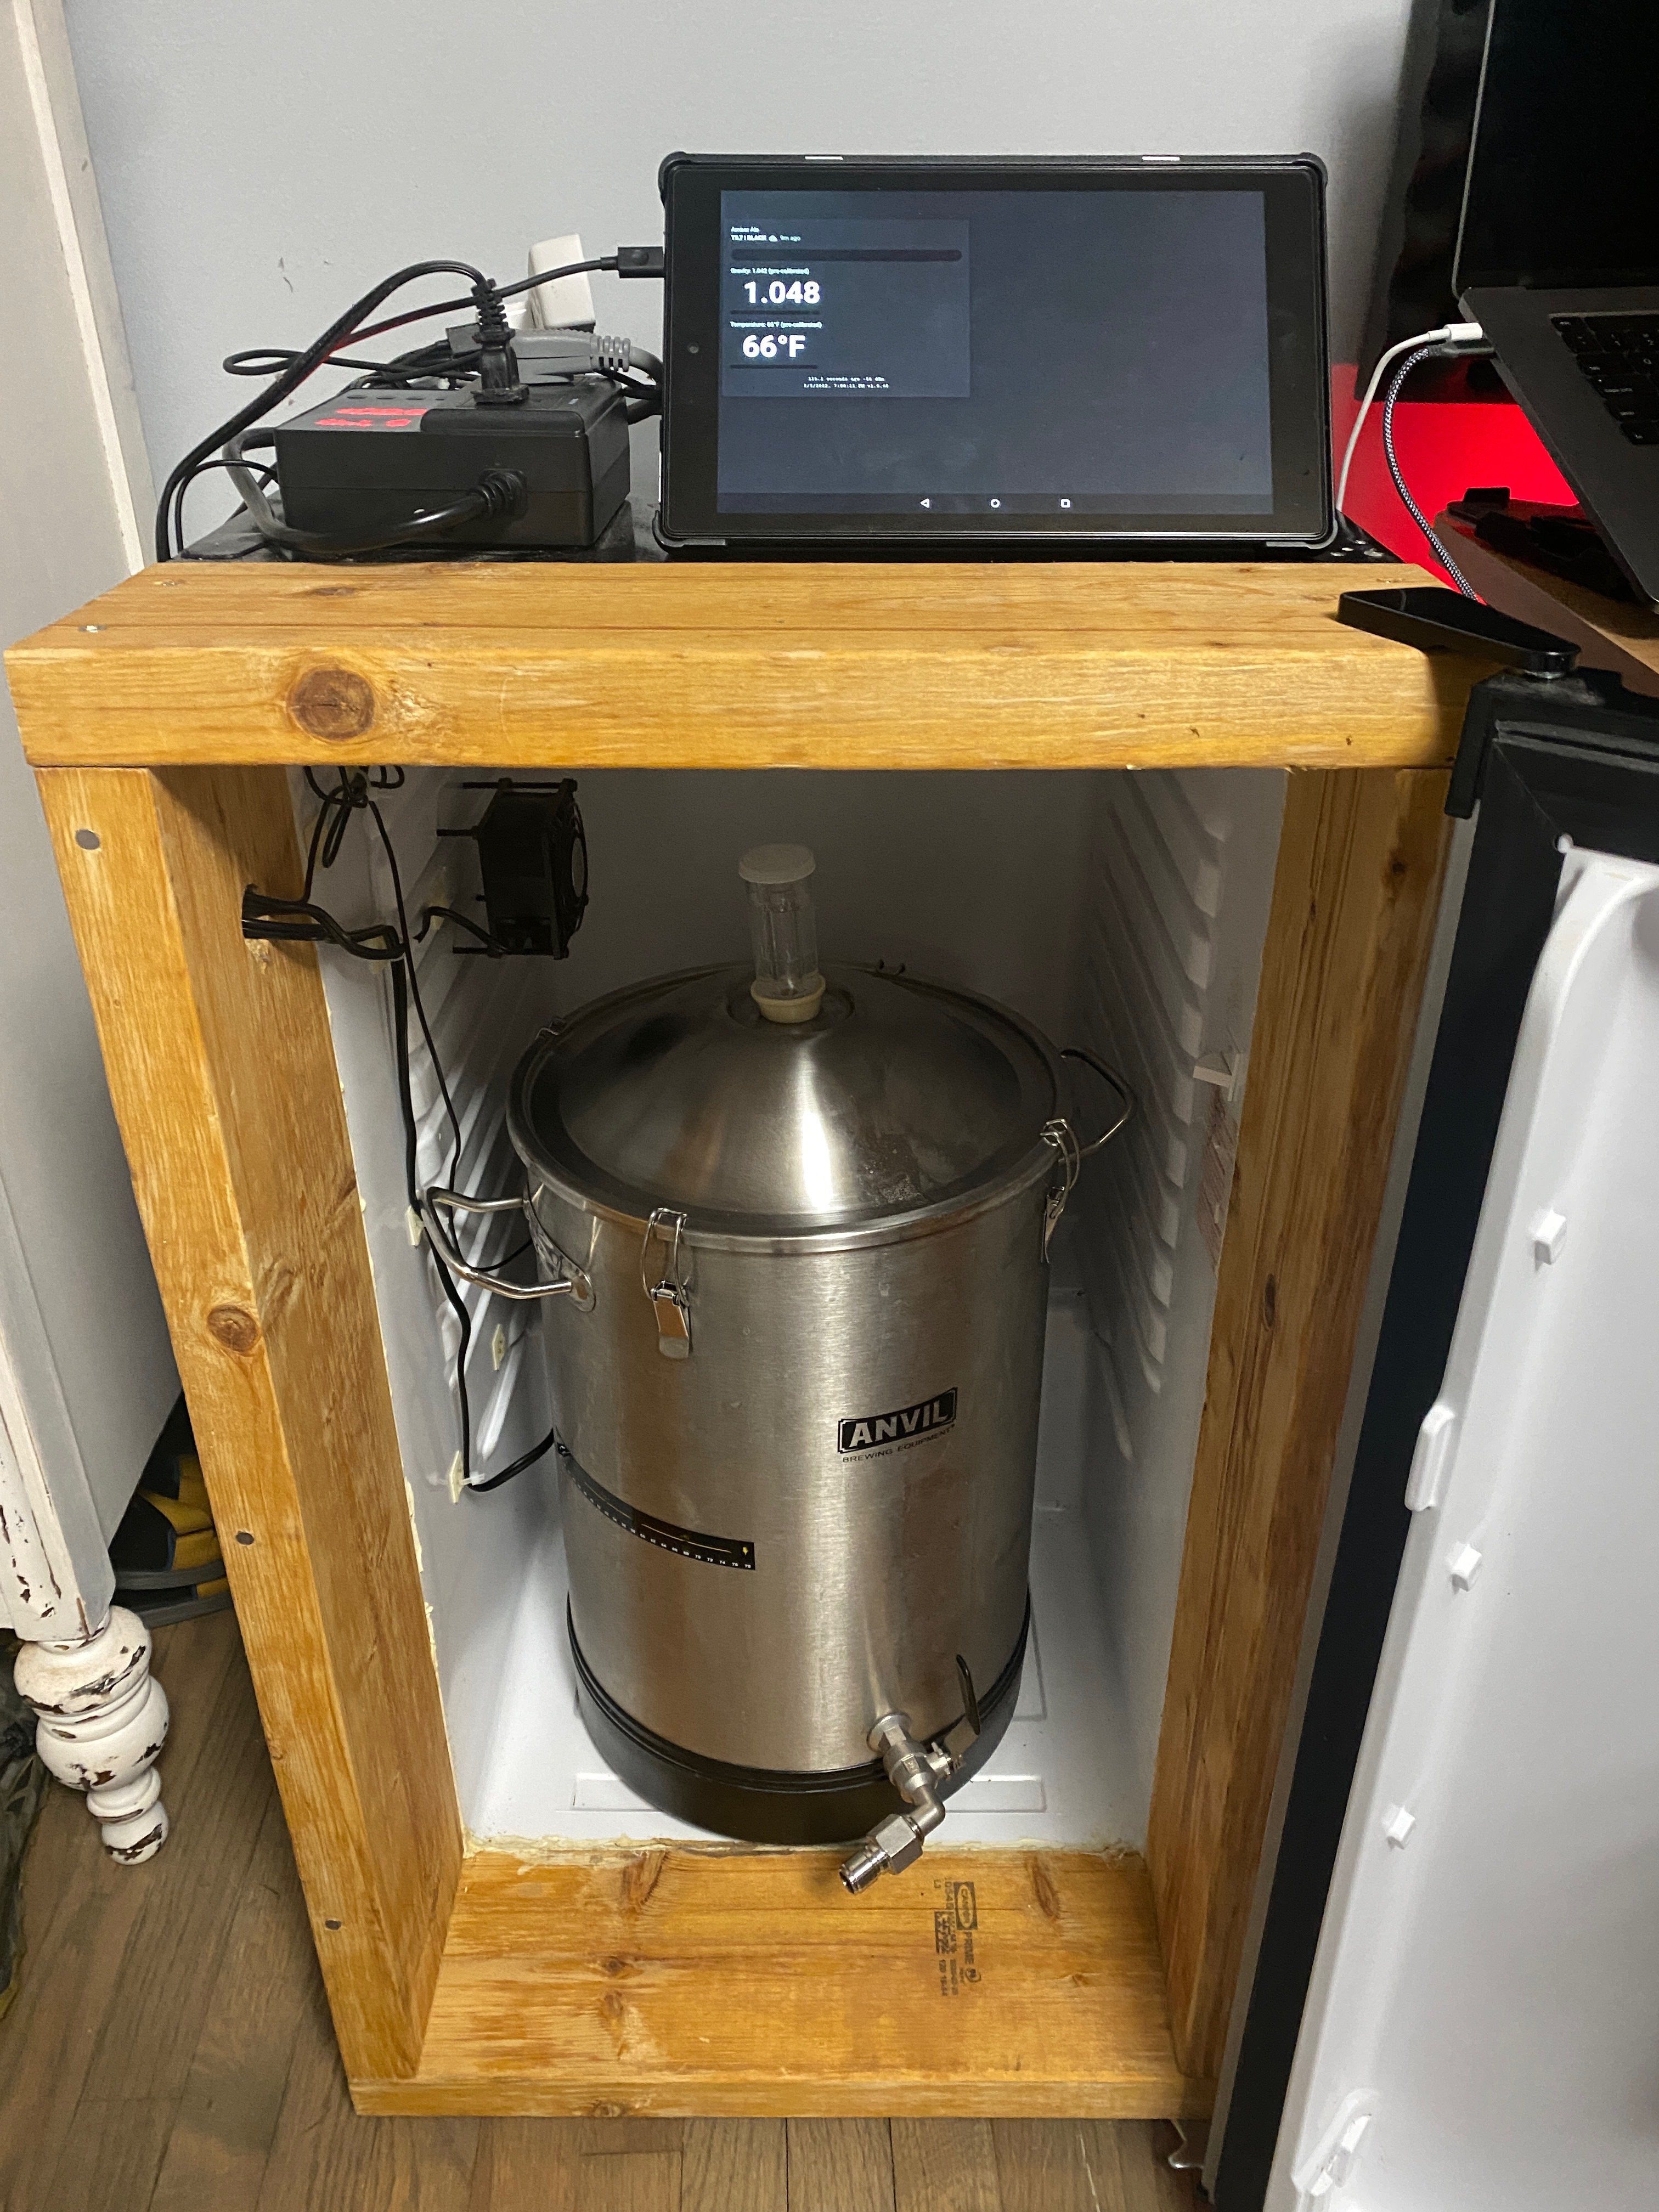
I recently purchased a Tilt V3 from eBay for $135.00 (with tax $143.10) and while I waited for it to arrive, I built out a custom integration and web interface to view a fermentation rate and temperature chart in. Here is a link to the web interface and integration: https://tinyurl.com/yapntawv
I wanted to share with the community and get any feedback! The data currently being shown was captured via the Tilt Google Spreadsheet integration but is obviously not from a real batch of beer. Instead, I just threw some sugar water into a vessel with the Tilt, adjusted the temperature a few times, and added some fresh water to bring the gravity down just to capture some real-time data. I will be brewing Memorial Day weekend and plan to use it as the real deal then.
Feel free to let me know any features or metrics I should possibly add.
Here is a screenshot of the interface and application:
Last edited:


 .
.